5 Steps to Turn Your Construction Project Data into Action
Hospital construction projects create A LOT of data, and more than 90% of that data in the engineering and construction industry goes unused. Data-driven companies are more productive, more agile and more profitable – making it crucial for construction leaders to find ways to convert their data into actionable insights.
Turning data into action means spending less time searching for the data you need and organizing it so you can make better decisions, faster. In order to leverage the benefits of data-driven decision making, you need to invest some time putting together a process plan that will turn your project data into action.
In this post, we’re going to walk you through the 5 steps we use at FreightTrain for turning project data into action for our customers and are built into the core of our software solutions.
Our 5 Step Process to Turning Your Project Data into Action:
- Define the Project Goals
- Define the Action(s)
- Define who is responsible for taking the action
- Identify and Locate the data
- Measure Progress
1. Define the Project Goals
Before you do anything with data, the first step to turning project data into action is to define your desired goals or outcomes. These goals should be SMART (specific, measurable, actionable, time-bound, and realistic).
Here are some examples of common goals you probably have for your construction project:
- Close all outstanding project issues before ribbon-cutting ceremony
- Comply with local building inspection requirements
- Make sure each room has the correct equipment installed
2. Define the Action Needed, And 3. Who is Responsible for Taking Action
It’s easier to combine steps 2 and 3 to determine who is responsible for taking what action.
- The Project Manager needs to solve project issues, often by collaborating with contractors and consultants;
- The Compliance Officer needs to verify all required inspections are completed and approved;
- The Logistics Manager needs to request products from the warehouse;
Each of these examples has an Action highlighted and a person responsible for taking each action.
The Project Manager example highlights how multiple people and companies are involved in hospital construction projects. The complexity of a healthcare project means it is important to establish a collaborative environment. Make sure to include external people who may need to have access to the data in order for you to take action, like solving a vendor-related problem holding up the project.
4. Identify and Locate the Data
Identifying the data simply means figuring out what information the teams identified above needs in order to take the desired action. Continuing with our examples from above:

- The project manager needs to know what the details of the issues are, including viewing any photos of the images or related vendor documents before they can solve an issue. The project manager may also need to be able to share this information with a vendor to help solve the issue on their end. This project manager needs to know who is involved in an issue that should be informed to solve the issue. Since the project manager is probably managing multiple issues, they need all this information readily accessible for each issue before they are able to take action.
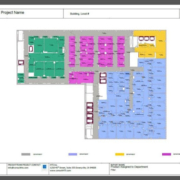
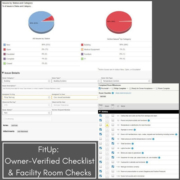
- A compliance officer requires information on the inspectors, the inspections they did, and details related to the building construction, floor plans, etc. to verify compliance with local regulations. They will also need a way to track each inspector on the project and the results of their inspection reports.
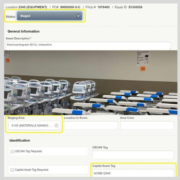
- A logistics manager will need to be able to match deliveries and equipment to the designated installation point so they can direct contractors to deliver and install the equipment in the right room. They’ll need to be able to track the status of all products until they are installed in the correct location. They have to create and print labels to use on incoming deliveries to track item from point of delivery to installation.
Depending on the tools you use to capture project data, this step can take a few iterations until you figure out exactly what data you need and where that data is located. If you’re using spreadsheets and multiple systems that don’t integrate, it is challenging to manage version control of the documents and locate the data you need. If you’re using a digital solution like FitUp or QCView, then all of this is managed in one place for your project.
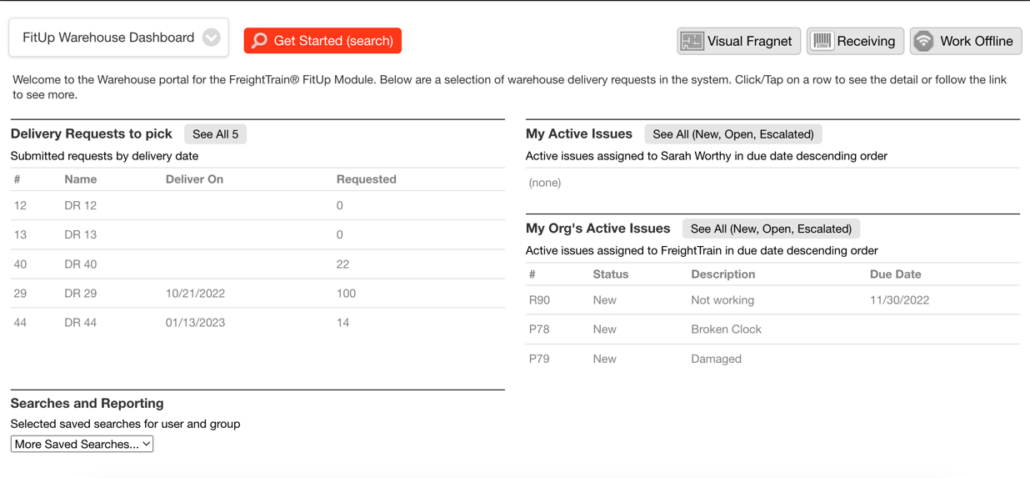
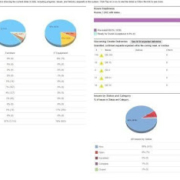
5. Measure Progress
The final step includes creating the reports that visualize information for reporting, usually in the form of a dashboard. It’s important when you build your dashboards and reports that you don’t clutter up the space with a bunch of bar graphs and charts that don’t provide any relevant information to the stakeholder.
When possible, you want to create a custom dashboard or report for each stakeholder to focus on just the information they need to take the action quickly. The project manager, compliance officer, and logistics manager all require different data to make appropriate decisions.
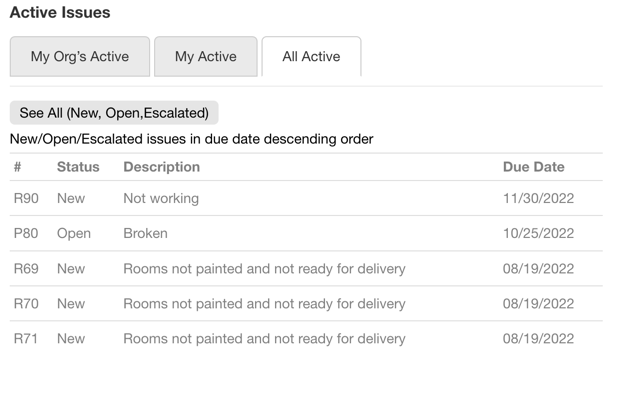
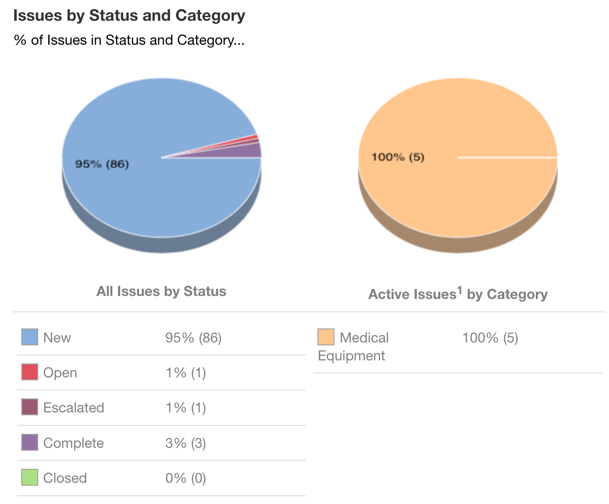
- The project manager needs a report with information measuring KPIs such as total number of issues, issue status, issue by category, issue by vendor, and issue resolution average times.
- The compliance officer dashboard should show KPIs such as which rooms require inspections, completed inspections, inspections pending, inspection scores, plus any specific notes from inspections that failed.
- The logistics manager is going to need KPIs that show all deliveries, where each shipment is stored and where it needs to be delivered onsite, track which items have been moved onsite, where expected deliveries should be taken for storage and then installation, etc.
Conclusion
Following these 5 steps will help you create a project plan to transforms your data into actionable insights so your construction projects go more smoothly and with fewer unexpected costs.
At FreightTrain, we build digital solutions to make data-driven project management simple!
If you’re interested in learning how FreightTrain’s software solutions streamline and automate this process for our customers, contact us today!


Leave a Reply
Want to join the discussion?Feel free to contribute!